-
 Apr 25, 2017 U.S. Home Sales Jump 4.4 Percent in March
According to the National Association of Realtors, existing-home sales took off in March 2017 to their highest pace in over 10 years, and severe supply shortages resulted in the typical home coming off the market significantly faster than in February and a year ago. Only the West saw a decline in sales activity in March.
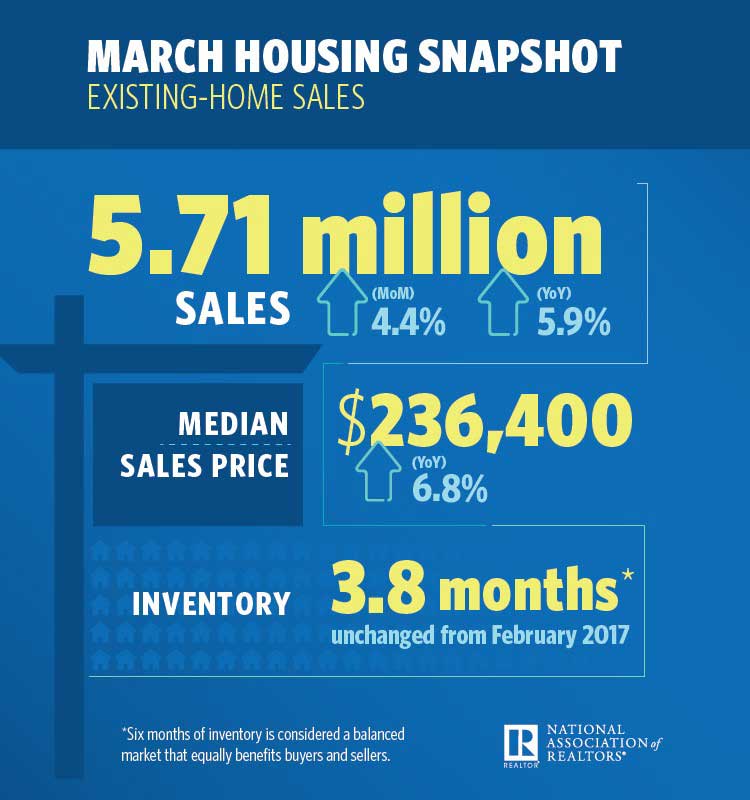
Total existing-home sales, which are completed transactions that include single-family homes, townhomes, condominiums and co-ops, ascended 4.4 percent to a seasonally adjusted annual rate of 5.71 million in March from a downwardly revised 5.47 million in February. March’s sales pace is 5.9 percent above a year ago and surpasses January as the strongest month of sales since February 2007 (5.79 million).
Lawrence Yun, NAR chief economist, says existing sales roared back in March and were led by hefty gains in the Northeast and Midwest. “The early returns so far this spring buying season look very promising as a rising number of households dipped their toes into the market and were successfully able to close on a home last month,” he said. “Although finding available properties to buy continues to be a strenuous task for many buyers, there was enough of a monthly increase in listings in March for sales to muster a strong gain. Sales will go up as long as inventory does.”
The median existing-home price for all housing types in March was $236,400, up 6.8 percent from March 2016 ($221,400). March’s price increase marks the 61st consecutive month of year-over-year gains.
Total housing inventory at the end of March increased 5.8 percent to 1.83 million existing homes available for sale, but is still 6.6 percent lower than a year ago (1.96 million) and has fallen year-over-year for 22 straight months. Unsold inventory is at a 3.8-month supply at the current sales pace (unchanged from February).
Added Yun, “Bolstered by strong consumer confidence and underlying demand, home sales are up convincingly from a year ago nationally and in all four major regions despite the fact that buying a home has gotten more expensive over the past year.”
Properties typically stayed on the market for 34 days in March, which is down significantly from 45 days in February and 47 days a year ago. Short sales were on the market the longest at a median of 90 days in March, while foreclosures sold in 52 days and non-distressed homes took 32 days (shortest since NAR began tracking in May 2011). Forty-eight percent of homes sold in March were on the market for less than a month.
Inventory data from Realtor.com reveals that the metropolitan statistical areas where listings stayed on the market the shortest amount of time in March were San Jose-Sunnyvale-Santa Clara, Calif., 24 days; San Francisco-Oakland-Hayward, Calif., 25 days; Seattle-Tacoma-Bellevue, Wash., and Denver-Aurora-Lakewood, Colo., both at 28 days; and Vallejo-Fairfield, Calif., 31 days.
“Last month’s swift price gains and the remarkably short time a home was on the market are directly the result of the homebuilding industry’s struggle to meet the dire need for more new homes,” said Yun. “A growing pool of all types of buyers is competing for the lackluster amount of existing homes on the market. Until we see significant and sustained multi-month increases in housing starts, prices will continue to far outpace incomes and put pressure on those trying to buy.”
According to Freddie Mac, the average commitment rate for a 30-year, conventional, fixed-rate mortgage rose for the fifth straight month in March to 4.20 percent from 4.17 percent in February. The average commitment rate for all of 2016 was 3.65 percent.
First-time buyers were 32 percent of sales in March, which is unchanged from February and up from 30 percent a year ago. NAR’s 2016 Profile of Home Buyers and Sellers – released in late 2016 – revealed that the annual share of first-time buyers was 35 percent.
All-cash sales were 23 percent of transactions in March, down from 27 percent in February and 25 percent a year ago. Individual investors, who account for many cash sales, purchased 15 percent of homes in March, down from 17 percent in February but up from 14 percent a year ago. Sixty-three percent of investors paid in cash in March.
Distressed sales – foreclosures and short sales – were 6 percent of sales in March, down from 7 percent in February and 8 percent a year ago. Five percent of March sales were foreclosures and 1 percent were short sales. Foreclosures sold for an average discount of 16 percent below market value in March (18 percent in February), while short sales were discounted 14 percent (17 percent in February).
Single-family and Condo/Co-op Sales
Single-family home sales climbed 4.3 percent to a seasonally adjusted annual rate of 5.08 million in March from 4.87 million in February, and are now 6.1 percent above the 4.79 million pace a year ago. The median existing single-family home price was $237,800 in March, up 6.6 percent from March 2016.
Existing condominium and co-op sales increased 5.0 percent to a seasonally adjusted annual rate of 630,000 units in March, and are now 5.0 percent higher than a year ago. The median existing condo price was $224,700 in March, which is 8.0 percent above a year ago.
Regional Breakdown
March existing-home sales in the Northeast surged 10.1 percent to an annual rate of 760,000, and are now 4.1 percent above a year ago. The median price in the Northeast was $260,800, which is 2.8 percent above March 2016.
In the Midwest, existing-home sales jumped 9.2 percent to an annual rate of 1.31 million in March, and are now 3.1 percent above a year ago. The median price in the Midwest was $183,000, up 6.2 percent from a year ago.
Existing-home sales in the South in March rose 3.4 percent to an annual rate of 2.42 million, and are now 8.5 percent above March 2016. The median price in the South was $210,600, up 8.6 percent from a year ago.
Existing-home sales in the West decreased 1.6 percent to an annual rate of 1.22 million in March, but are still 5.2 percent above a year ago. The median price in the West was $347,500, up 8.0 percent from March 2016.
About author
-
-
About Author
Alan Bermudez
-
© 2017 iLookHomes. All rights reserved - Privacy Policy


leave a comment